How and why do we model data?
From Music Data to Visualization
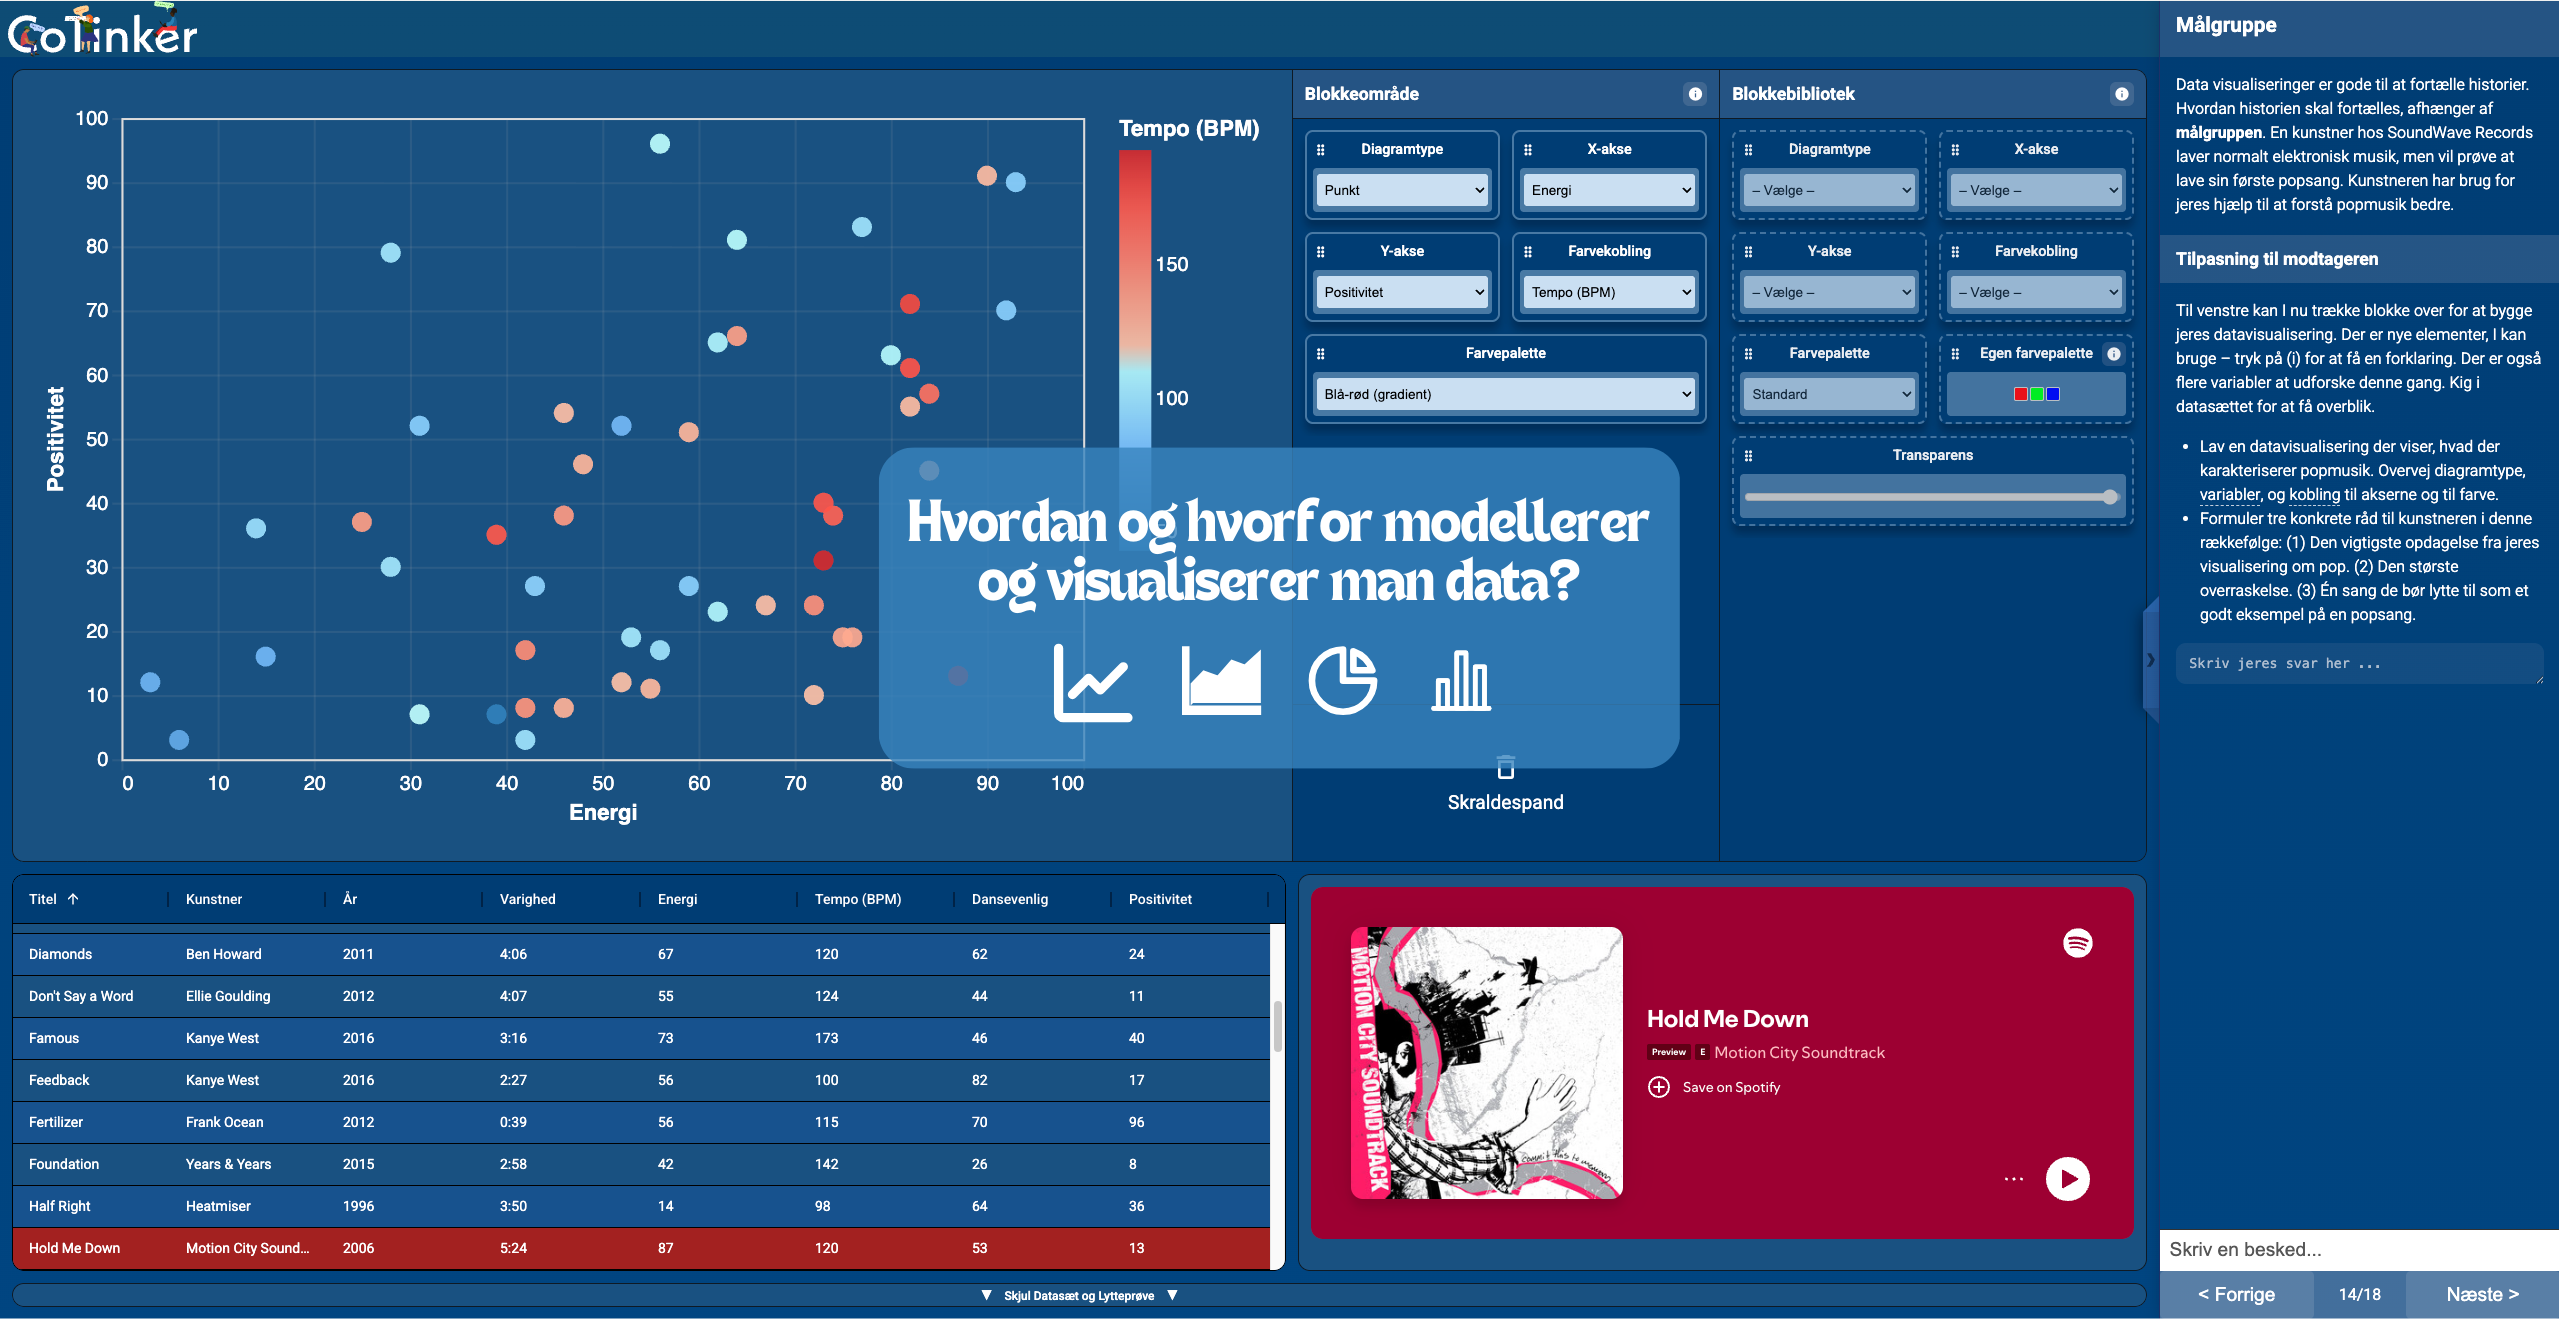
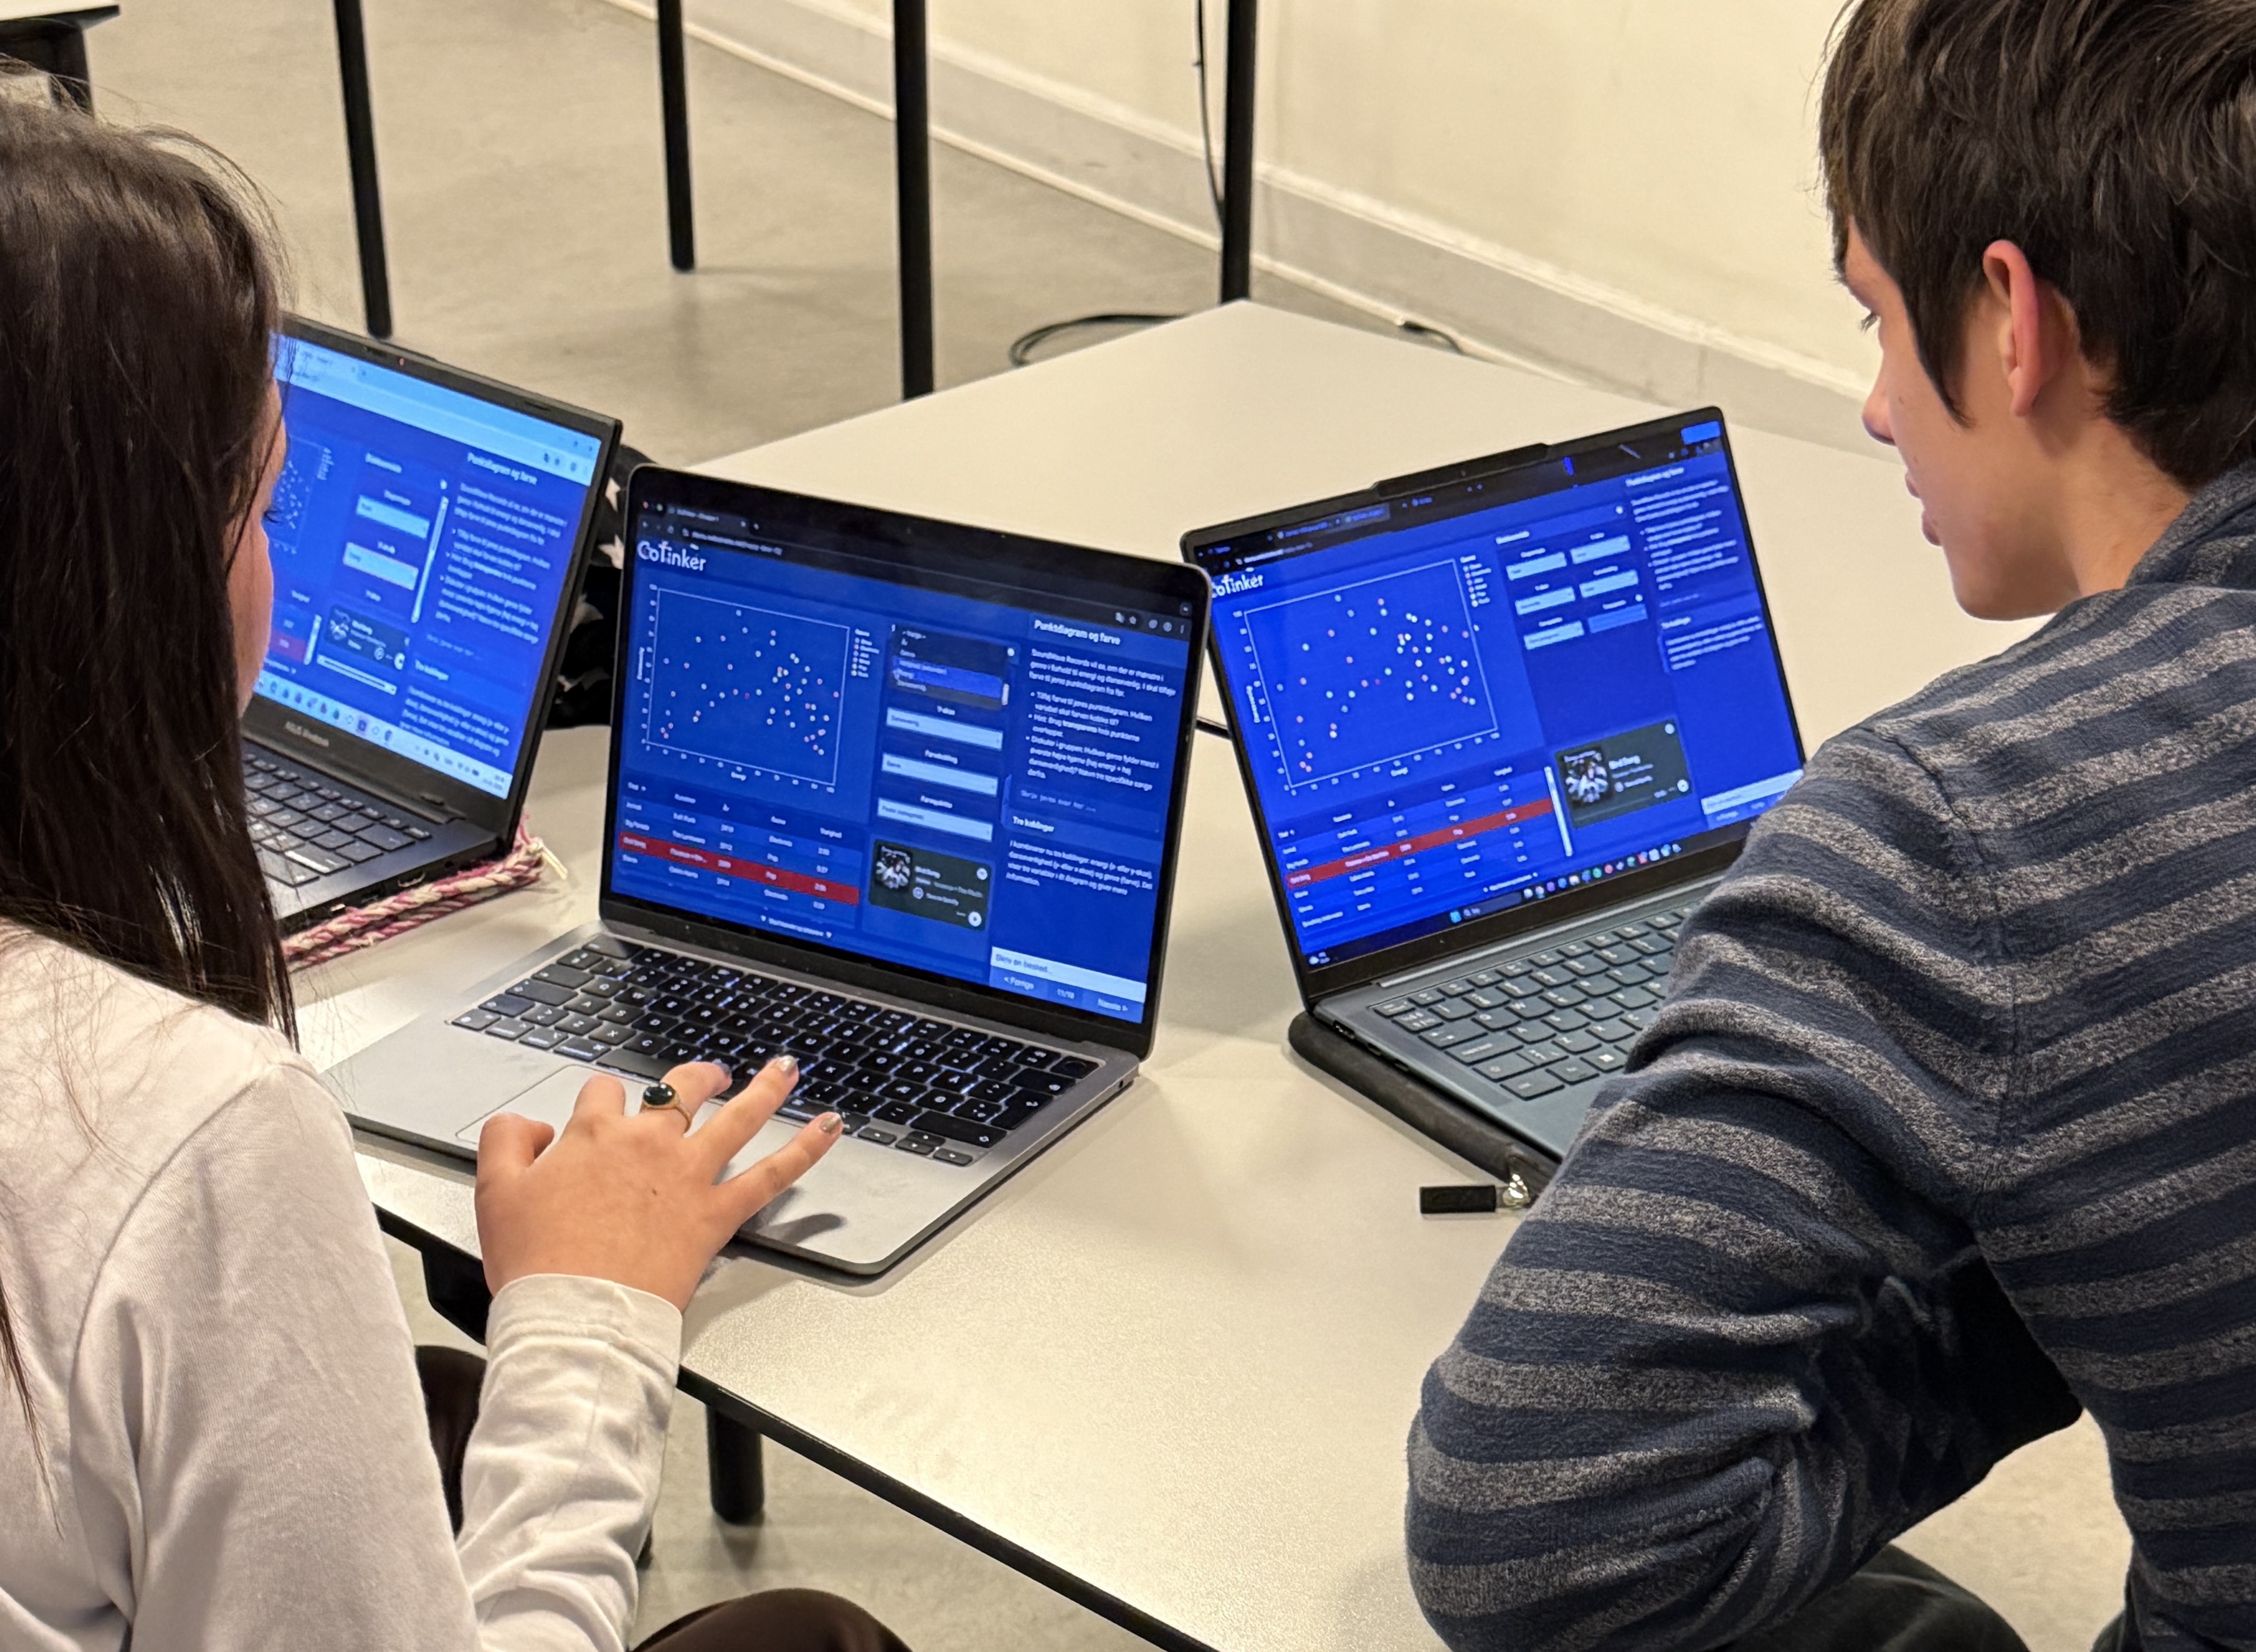
This activity explores data visualization using music data as its starting point. Working in groups, students discover how to transform data about songs into visualizations using a block-based tool. As they work, they can continuously see how their visualizations are developing on their phones and experiment with different approaches.
Students begin by reflecting on what data can be collected about songs, then work on understanding data types and structure through a music data table. They are then introduced to the block-based tool, where they build bar charts, line graphs, and scatter plots by connecting visual properties such as colour and position to variables from the dataset.
Students compare the diagram types and reflect on their differences. Finally, they work on tailoring visualizations for specific audiences and explore manipulation techniques such as axis changes and misleading titles to understand ethical grey areas in data visualization.
The module addresses the curriculum areas “Modellering” and “Repræsentation og manipulation af data”, as well as the competency area “Computational tænkning og modellering”. The activity takes 90–120 minutes depending on whether class discussions are included.
Teacher guide
Download the teacher guide for this activity. It includes a beginner-friendly introduction to data visualization, a full activity description, a subject terminology glossary, lesson plan suggestions, and supplementary resources.